Analytics & privacy
Understand your analytics
Read revenue, conversion, traffic and recovery metrics with matching periods, settings and data coverage.
Reviewed
On this page
The app combines store records with storefront tracking. Revenue and orders can exist when visitor tracking is limited; visitor, channel and returning-customer measurements depend on the data available for that period. Start by matching the context before comparing two reports.
1. Match the store, period and filters
Select the store, open Analytics, and choose the date range you want to understand. Check the period label before opening Sales, Traffic, Customers, Conversions or Abandoned carts.
When comparing with the PrestaShop Back Office or another report, use the same store, date boundaries, timezone, currency and order criteria. A calendar day in the store's timezone may not have ended at the same moment as a day on your phone. Also check whether one report includes tax, shipping, unpaid orders or a different comparison period.
Use the comparison labels shown on the screen. A percentage change compares the displayed current and comparison periods; it is not a forecast. A short current period or a small previous total can produce a large percentage change.
2. Choose what revenue includes
In Settings → Revenue display, set Include tax (VAT) and Include shipping for the selected store. Return to the report after changing them. The setting changes the revenue presentation; it does not change an order, invoice, tax rate or the store's accounting records.
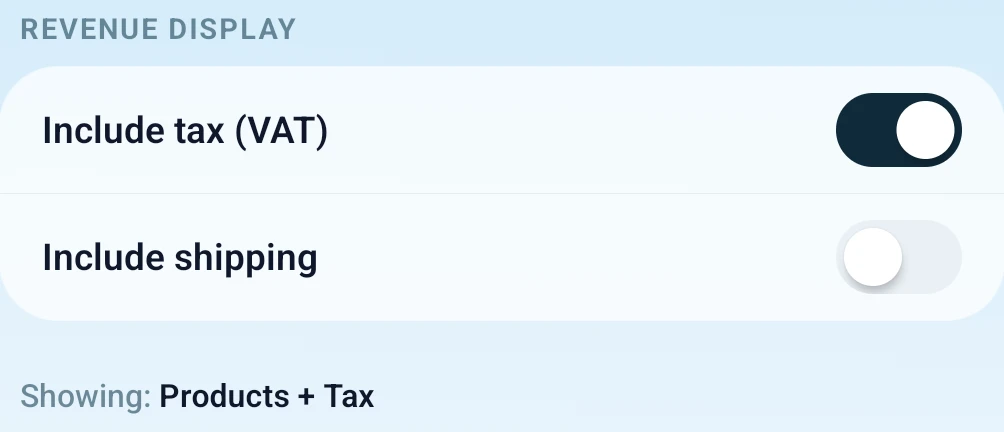 Choose the same tax and shipping basis as the report you are comparing with. Enlarge ↗
Revenue uses confirmed/paid orders marked valid by PrestaShop. Product discounts are deducted. These are the four combinations:
| Include tax | Include shipping | Revenue basis |
|---|---|---|
| Off | Off | Products minus discounts, excluding tax. |
| On | Off | Products minus discounts, including tax. |
| Off | On | Products minus discounts, plus shipping; all excluding tax. |
| On | On | Products minus discounts, plus shipping; all including tax. |
For example, suppose a valid order has €100 of products excluding tax, a €10 discount excluding tax, 20% tax on both, and €5 shipping excluding tax (€6 including tax). The four results above are €90, €108, €95 and €114 respectively. This is an illustration of the display calculation, not a tax-rate recommendation.
An orders count and revenue need not move together. A newly placed unpaid order can exist without contributing to valid-order revenue. When a total differs, inspect the underlying order's payment/valid status and amounts before changing the revenue switches.
3. Read the conversion funnel correctly
Open Analytics → Conversions. The commerce funnel follows Carts → Checkout → Orders. Its cart-to-order conversion uses orders divided by carts with items. It is not automatically the same metric as “orders divided by all website visitors” in another analytics product.
Keep the populations separate:
| Measurement | What to keep in mind |
|---|---|
| Carts with items | A shopping action, rather than every storefront visit. |
| Checkout | Progress into checkout; it does not prove a completed payment. |
| Orders | Order creation, with paid/valid orders represented separately where shown. |
| Visitors and view-to-cart rates | Depend on storefront measurement and consent coverage. They use a different population from commerce totals. |
The selected period groups carts by when their first item was added. Checkout and order counts include only those carts if the corresponding event happened by the end of that period. For example, a cart that first received an item yesterday and became an order today is not part of today's commerce funnel. An order after the selected period ends is not counted in that period's funnel either. This is why funnel orders may differ from PrestaShop orders created during the same dates. Do not interpret every difference between adjacent stages as a technical checkout failure.
4. Understand traffic and consent coverage
Open Analytics → Traffic to inspect the available visitor and acquisition data. If visitors or channels are unavailable, check Module → Privacy before assuming the store has no traffic.
In Consent-first mode, visitors without analytics consent have no visitor or session identifier. Commerce totals still work. Analytics mode provides a short-lived first-party session before consent. Full analytics starts persistent identifiers by default but removes PrestaOne analytics cookies after explicit rejection or withdrawal.
These choices change what can be measured. They do not recreate earlier visits that were never recorded. A mode change, module installation date, missing storefront script, consent refusal or an unsupported consent integration can limit comparisons over time. Read coverage and unavailable-state messages as part of the report.
Use Configure tracking and consent for the actual setup and verification. Do not enable a broader mode just to make a chart look complete.
5. Separate abandoned carts from recovered revenue
Open Analytics → Abandoned carts for cart activity and individual cart details. Reminder setup and sending results live in the module's Abandoned Carts Recovery tab.
An abandoned cart is not the same as an eligible email recipient. A cart may lack an email address, fail your audience or minimum-value rule, be too recent, fall in quiet hours, or already have an order. Likewise, a reminder recorded as sent does not prove it reached the inbox or caused a sale.
Recovery reporting attributes qualifying paid/valid orders within its 14-day attribution window. Match the labels on each result card: “today” and a rolling multi-day result are different windows. Recovery value and your chosen dashboard revenue display may also have different bases, so do not expect every summary to be interchangeable.
Use the recovery guide when comparing reminders, recovered orders and recovered value.
6. Treat stock forecasts as estimates
Find Stock watch on the dashboard. Use its recent-sales and stock signals to identify products that need attention, then inspect the product or combination before purchasing stock.
Projected demand or time until stock runs out depends on historical sales and current stock. Promotions, seasonal demand, restocking and product changes can make the future different from that history. A missing estimate is not a promise of unlimited stock, and a forecast is not a purchase order.
When two reports still disagree
Write down one concrete comparison: the store, date range, timezone, currency, tax/shipping choices, displayed values and exact metric names. Check the underlying orders or carts for that same scope. If it remains unexplained, send those settings and a cropped, anonymised example through Help. Avoid sending a full customer or order export when a small example will explain the issue.